Nationwide New Heights® IUL Accumulator 2020 and the J.P. Morgan Mozaic IISM Index
An IUL with Historical Returns of 10%?
The results are compelling
When looking historically at 10-year rolling period averages, the hypothetical example shows the frequency the uncapped 2-year J.P. Morgan Mozaic IISM Indexed Interest Strategy would have credited rates at or above 10%.
The Value of an Uncapped Strategy
While no analysis can predict what any single product will credit, historical rates of return for the underlying index may be useful to help better understand the interest crediting method of indexed life insurance products.
The chart below is a hypothetical example that shows the frequency at which the uncapped 2-year J.P. Morgan Mozaic IISM Indexed Interest Strategy in Nationwide New Heights® Indexed Universal Life Accumulator 2020 (New Heights® IUL) versus a 9.5% capped strategy would have achieved certain interest credits averaged over 10-year rolling periods.
Hypothetical New Heights® IUL Uncapped Interest Crediting Frequencies1
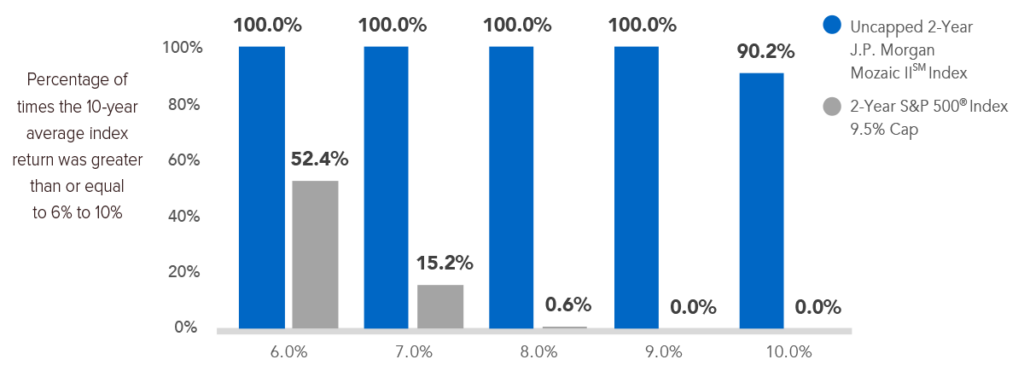
This graph illustrates the frequency that a 10-year average Hypothetical Index Return is greater than or equal to 6% to 10%. The analysis compares two indexed interest strategies:
a.) 2-year J.P. Morgan Mozaic IISM strategy with a 190% participation rate and no cap rate to b.) 1-year S&P 500® strategy with a 100% participation rate and a 9.5% cap rate. Both strategies are point-to-point and have a 0% floor rate. A compound annual growth rate (CAGR) is calculated based on money placed in the strategy and held there for 10 years. The 10-year segments start every month between 11/15/1996 and 6/15/2020, and the last period ends 6/15/2020 for a total of 164 periods.
Only the investment is considered with the stated participation, cap and floor rates, with no other product impacts such as additional premiums or fees. This averaging method smooths out returns and is different from what the hypothetical annual crediting rate would have been. For example, the 10-year averages for the J.P. Morgan Mozaic IISM strategy was greater than 6% for all 164 of the ten-year periods, not that every single year was greater than 6%. The hypothetical 10-year averages provide a longer-term perspective on historical crediting rates. The J.P. Morgan Mozaic IISM Index was established on 12/28/16. Performance shown is back-tested by applying the indexed interest strategies to historical financial data when all components are available and was designed with the benefit of hindsight. Back-tested performance is hypothetical and has been provided for informational purposes only. Additional crediting options are available in the Nationwide New Heights® IUL Accumulator 2020 product.
The chart does not represent actual historical results and does not predict or guarantee future performance.
See the power of uncapped interest crediting.
FINANCIAL PROFESSIONAL OR AGENT USE ONLY. NOT FOR USE WITH THE PUBLIC.
1 This graph illustrates the frequency that a 10-year average Hypothetical Index Return is greater than or equal to benchmark rates ranging from 6% to 10%. The analysis compares two indexed interest strategies: a.) 2-year J.P. Morgan Mozaic IISM strategy with a 190% participation pate and no cap rate to b.) 2-year S&P 500® strategy with a 100% participation rate and a 9.5% cap rate. Both strategies are point-to-point and have a 0% floor rate. A compound annual growth rate (CAGR) is calculated based on money placed in the strategy and held there for 10 years. The 10-year segments start every month between 11/15/1996 and 6/15/2020, and the last period ends 6/15/2020 for a total of 164 periods.
Only the investment is considered with the stated participation, cap and floor rates, with no other product impacts such as additional premiums or fees. This averaging method smooths out returns and is different from what the hypothetical annual crediting rate would have been. For example, the 10-year averages for the 2-year J.P. Morgan Mozaic IISM strategy was greater than 6% for all 164 of the ten-year periods, not that every single year was greater than 6%. The hypothetical 10-year averages provide a longer-term perspective on historical crediting rates.
The J.P. Morgan Mozaic IISM Index was established on 12/28/16. The performance shown is back-tested by applying the indexed interest strategies to historical financial data when all components are available and was designed with the benefit of hindsight. Back-tested performance is hypothetical and has been provided for informational purposes only. Additional crediting options are available in the Nationwide New Heights IUL Accumulator 2020 product.
The chart does not represent actual historical results and does not predict or guarantee future performance.
This material is not a recommendation to buy, sell, hold or roll over any asset, adopt an investment strategy, retain a specific investment manager or use a particular account type. It does not take into account the specific investment objectives, tax and financial condition or particular needs of any specific person. Investors should discuss their specific situation with their financial professional.
Nationwide New Heights Indexed Universal Life Accumulator 2020, indexed universal life insurance, is issued by Nationwide Life and Annuity Insurance Company, Columbus, Ohio. All guarantees and benefits of the insurance policy are backed by the claims-paying ability of the issuing carrier. Nationwide and its affiliates are not affiliated with Annexus, Annexus’s affiliates or the Independent Distribution Company (IDC) distributing this communication.
Indexed universal life insurance policies are not stock market investments, do not directly participate in any stock or equity investments, and do not receive dividends or participate in capital gains. Past index performance is no indication of future crediting rates. Also, be aware that interest crediting fluctuations can lead to the need for additional premiums in the policy.
When choosing a product, make sure that life insurance needs are met. Because personal situations may change (i.e., marriage, birth of a child or job promotion), so can life insurance and long-term care insurance needs. Care should be taken to ensure these strategies and products are appropriate. Associated costs, as well as personal and financial objectives, time horizons and risk tolerance should all be weighed before purchasing a product. Life insurance, and long-term care coverage linked to life insurance, has fees and charges associated with it that include: costs of insurance, which vary based on characteristics of the insured such as sex, tobacco use, health and age; and additional charges for riders that customize a policy to fit individual needs.
The general information presented here is not intended to be, nor should it be, treated as tax, legal, accounting or other professional advice. Additional facts and circumstances may exist that would impact the tax treatment of a specific transaction. Taxpayers should seek advice from an independent tax advisor before acting on any information presented. Federal tax laws are complex and subject to change. Neither Nationwide nor its representatives give legal or tax advice. Consult with your attorney or tax advisor for answers to specific questions. Nationwide and its affiliates are not affiliated with Annexus, Annexus’s affiliates or the Independent Distribution Company (IDC) distributing this communication.
Nationwide, the Nationwide N and Eagle, Nationwide is on your side, Nationwide New Heights and New Heights are service marks of the Nationwide Mutual Insurance Company.
© 2021 All Rights Reserved
FLM-1423AO-IM.1 [01/21]